Saturday, 5 December 2015

Stanning: A new NMR apodization function


Apodization refers to the mathematical processing technique by which the FID is multiplied pointwise by some appropriate function in order to improve the instrumental line shape. The term apodize actually derives from its Greek meaning “removing the feet”. The feet being referred to are actually the side-lobes found in the FT spectrum resulting from zero-filling a truncated FID (this phenomenon is also known as leakage).  
Probably the most widely used apodization function in NMR, especially in 13C spectroscopy, is the Exponential function although other functions such as Hanning are also very popular.
In this short post, I want to introduce a new apodization function, the so-called Stanning function which gives superior results compared to Exponential and Hanning apodization functions.
The name Stanning is a play on words which combines Hanning (which forms the basis of this function) with Stan, the inventor of this apodization function to whom all credit should be given.
The performance of this apodization function is illustrated with a 19F NMR spectrum whose FID is shown in Figure 1.

Figure 1

This FID consisted of ca 59K acquired data points which are then extended by zero filling to a final size of 128K. As the FID has not fully decayed to zero during acquisition, resulting FT spectrum will show the expected truncation artefacts, as shown in Figure 2.

Figure 2
Multiplication of the FID by an exponential function, in this case with a line broadening value of 1.0 Hz results in the following spectrum where the wiggles have been significantly reduced but not in a totally satisfactory way (see Figure 3).

Figure 3

Application of the new Stanning function yields the result depicted in Figure 4. As it can be seen, the truncation artifacts have been further reduced whilst the resolution of the spectrum is slightly better compared to the exponential function.

Figure 4

The mathematical formulation of Stanning as well as some additional illustrative examples will be covered in a future blog post. 

Saturday, 2 May 2015

NMR for iPad and Android: Beta testing


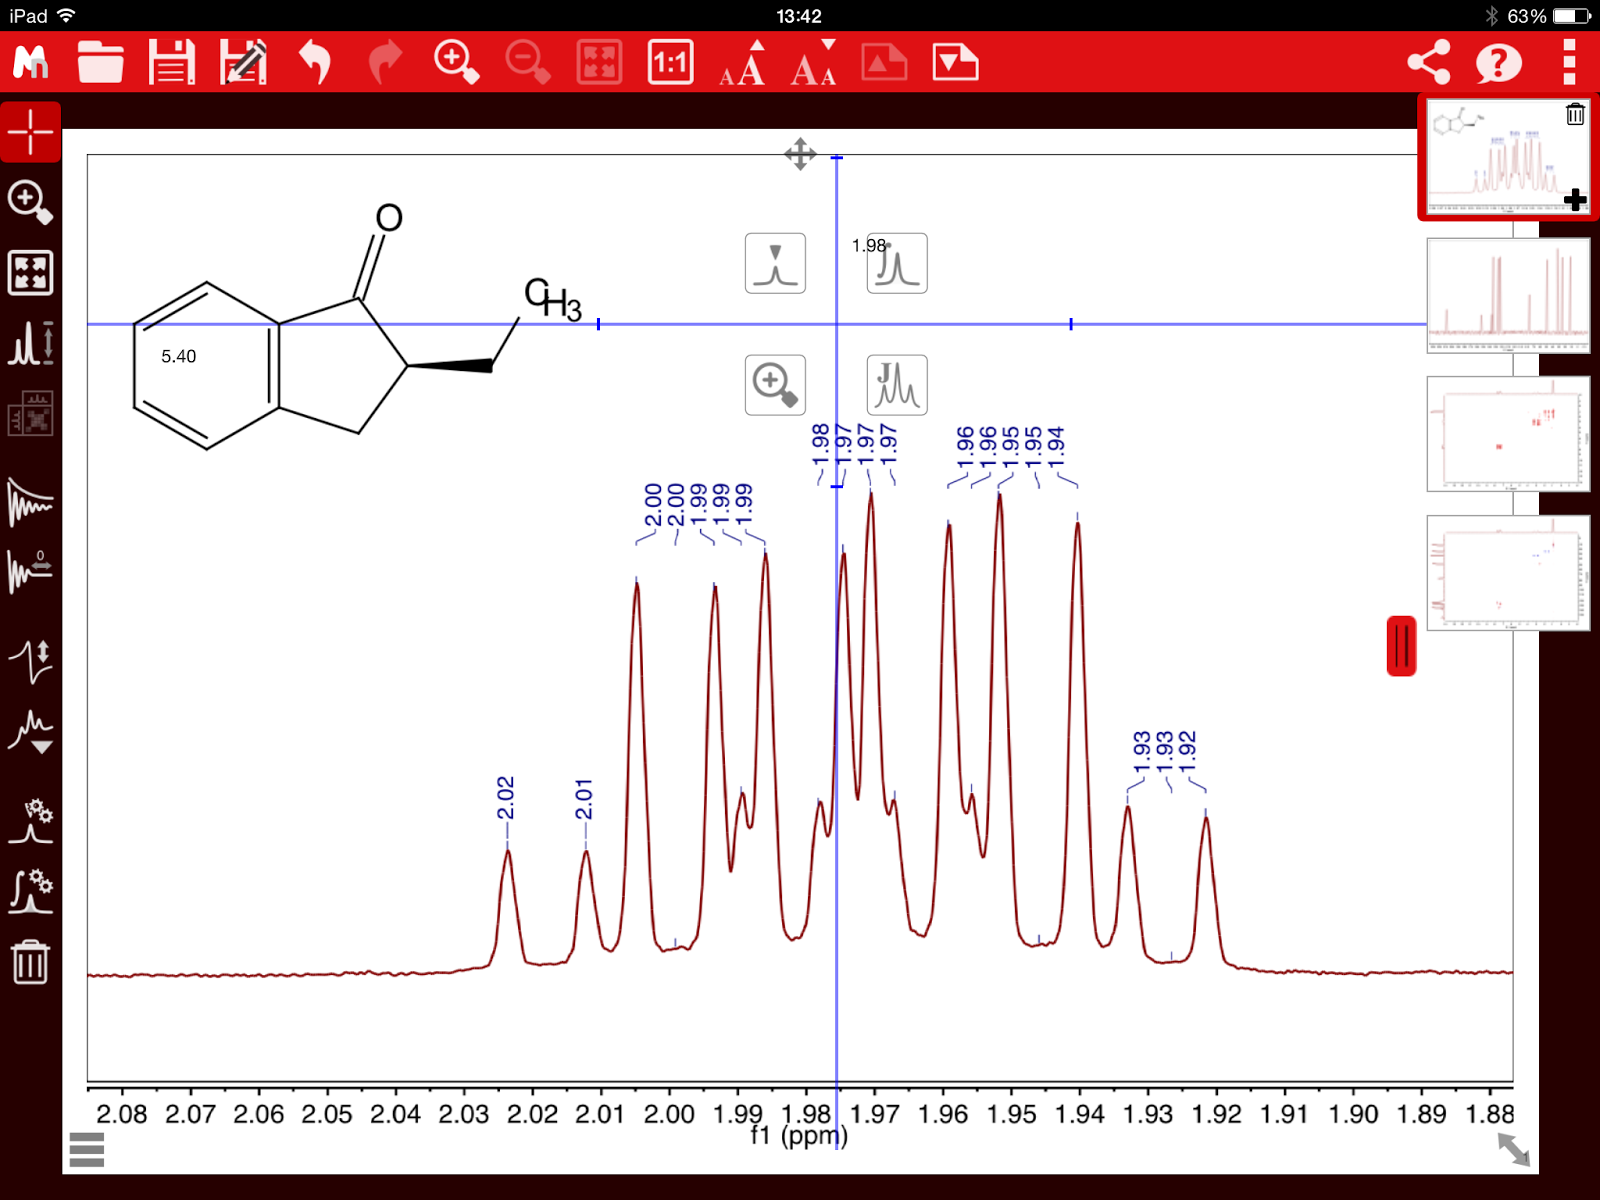
We at Mestrelab are delighted to announce our first iPad / Android app ever, Mnova Tablet. You won’t find it in the google or iPad stores though as it is still in the final Beta testing stage, but from these lines I’d like to welcome anyone willing to test it out. 
Just send me an email at carlos-at-mestrelab.com and I’ll be more than happy to give you the details on how to Beta test it for the platform of your choice


There is also an article in Magnetic Resonance in Chemistry which describes the main features of the app and how it was developed from a more technical point of view.


Free

The beauty of this app is that it provides a very simple and enjoyable mobile experience for NMR data processing and viewing, not to mention the fact that it’s free, at least for the basic functionality. This is how it works:

The free version reads all NMR data (including molecules) supported by Mnova (meaning that virtually all NMR data files will be supported) and transform the raw NMR data automatically, if need be. It also allows basic graphical manipulations, including zoom-in, panning, and spectral intensities expansions.
On the other hand, in order to edit or change any processing operations (apodization, phase, baseline, etc) or apply any analysis (peak picking, integration, multiplet analysis), it will be necessary to pay a small fee via in-app purchases in the Google or Apple stores. More details about this as soon as the official release becomes available.

Key features

  • Automatic processing of 1D and 2D NMR data sets in multiplet formats (Bruker, Varian/Agilent, Jeol, Magritek, Oxford Instruments, Nanalysis, Thermo picoSpin, amongst others)
  • Support of 1D arrayed experiments
  • Processing of 2D-NUS spectra
  • Dropbox support
  • Ability to import spectra directly from the email client and share the spectra or images to social media


Screen shots


Friday, 10 April 2015

Mbook: A new Electronic Laboratory Notebook that speaks NMR


When we founded Mestrelab back in 2005, our only commercial product was 100% about NMR data processing / analysis. Over these years, our NMR products have matured with an increasing number of features and robustness. At the same time, we have released other products such as LC/GC/MS and analytical DB software.
This week, we have released a new brand product, Mbook: This is an electronic Lab Notebook which we have been developing in collaboration with the Universities of Santiago de Compostela and Vigo, both in Spain.  
There are many ELNs out there already so why have we ventured into developing a new one? The short answer is that we believed that most of the existing solutions lacked a real integration between chemistry (i.e. reactions) and analytical data (e.g. NMR): One of the unique features of Mbook is that it is tightly integrated with Mnova so that any analytical data supported by the latter (1D & 2D NMR, LC/GC/MS) will be automatically handled by Mbook. Technically speaking, Mbook comes with a special version of Mnova which runs in the background. This means that when you upload, for example, and NMR experiment (i.e. raw FID), Mbook will process it automatically for you (via Mnova) so that you will see the processed spectrum automatically in your reaction. Of course, the raw data will always be available should you want to process it differently, either with your Mnova client or with any other NMR processing software.


Another feature worth mentioning is that Mbook has been designed solely and exclusively for synthetic organic chemists. If you do any other type of chemistry, Mbook will not be for you. If you are an organic chemist and you are looking for a new ELN, please give Mbook a try, we will be very happy to hear your feedback!
Oh! And it will soon be available as a native Android and iOS application, and, on that, we think it might be the first of its kind!